DNA content measured by Cytometry and Microscopy to Omics
In order to measure the genome size of an unknown species the control should be made out of non-diving cells with nucleus. In order to measure DNA content of mammalian cells, chicken (Gallus gallus domesticus) erythrocytes (1.25 pg) or nuclei from human inactivated leukocytes (7.0 pg) are commonly used. Most popular fluorochromes are propidium iodide (PI) and 4',6-diamidino-2-phenylindole (DAPI). DAPI was found to be good for staining because it binds specifically to double-stranded DNA (dsDNA) independent of the chromatin structure, resulting in peaks with a low coefficient of variation (CV) but it binds preferentially to AT-rich portions of the dsDNA [Zhu et al. 2012]. It is generally agreed that fluorochromes showing base preference (DAPI) should NOT be used for estimation of nuclear DNA content in cases where base content of a control and a sample differ [Doležel et al. 1992].

Genome size quantified by the PI-based flow cytometry measurements are considered to be as good as that measured by the Feulgen microspectrophotometry (method for determining the amounts of DNA in individual cell nuclei).
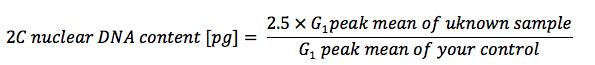
After performing flow cytometry measurements nuclear DNA content can be calculated using this formula if using Glycine max as your control:
After staining the cells and following flow cytometry analysis, simple calculation based on samples’ histograms will determine your samples’ DNA content. If using chicken RBCs:
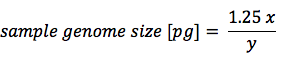
x – fluorescence channel number of your unknown sample
y – fluorescence channel number of chicken RBC
After calculating mean number DNA content one copy of genetic information (1C) can be determined by considering that 1 pg DNA equals 0.978*109 bp [Doležel et al., 2002].
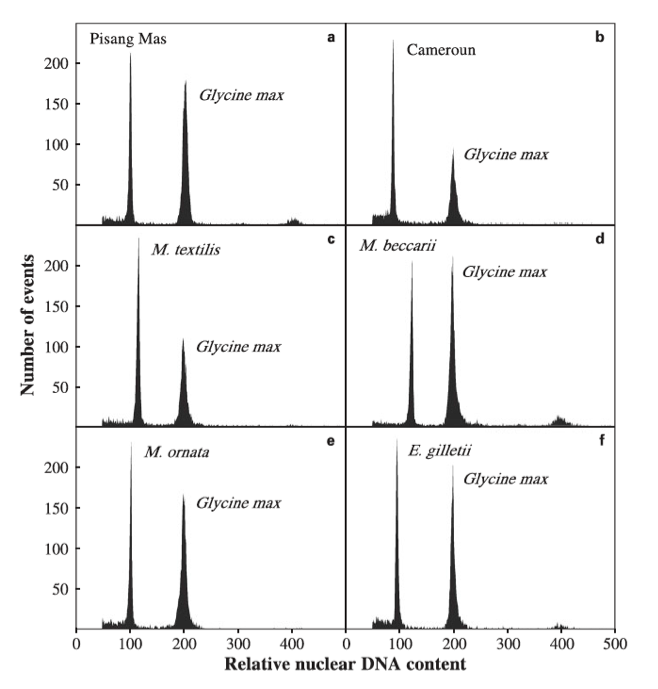
Control = Glycine max (2C = 2.5 pg). Unknown samples which nuclei were stained with PI [Musa (a-e) and Ensete (f) ]. Their relative DNA content was measured based on G0/G1 peak positions: (a) “Pisang Mas” (2C = 1.243 pg); (b) “Cameroun” (2C = 1.130 pg); (c) M. textilis (2C = 1.435 pg); (d) M. beccarii (2C = 1.561 pg) and (e) M. ornata (2C = 1.299 pg); (f) E. gilletii (2C = 1.210 pg). Picture obtained from Bartoš et al. 2005
Protocols
Protocols for staining whole cells with PI and PI/ Bromodeoxyuridine
Analysis of Nuclear DNA Content and Ploidy in Higher Plants
All work performed by the Roy J. Carver Biotechnology Center (CBC) should be acknowledged in scholarly publications, posters, and presentations. Proper recognition allows us to measure the impact of our work and supports our initiatives in obtaining sponsored funding. In addition, any CBC personnel who make a substantial intellectual or experimental contribution are deserving of further recognition as co-author.