10x Visium Spatial Transcriptomics
10X infrastructure
- Agilent DV200 Bioanalyzer
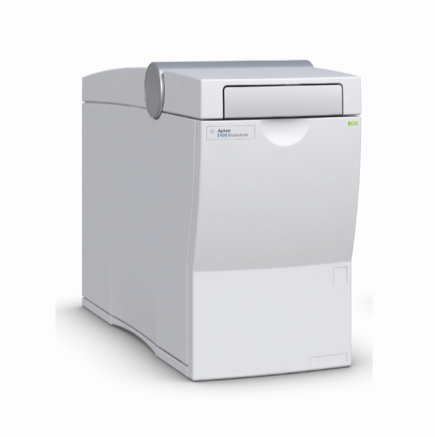
DV-200 Analysis
https://www.agilent.com/en/promotions/2100-bioanalyzer-dv200-determination
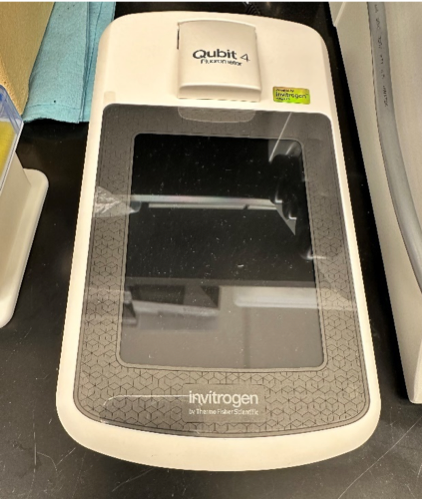
Invitrogen Qubit 4-RNA Quality Check (RIN)
Cryostat for Fresh Frozen 10x Visium workflow
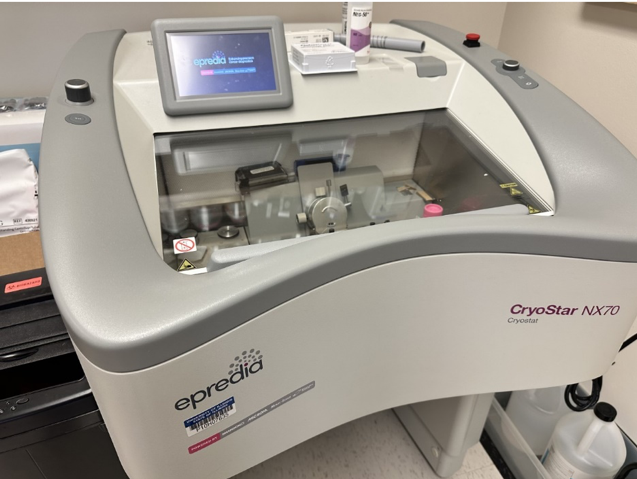
The System
https://epredia.com/solutions/cryotomy-solutions/
Operating Manual/Brochure
https://epredia.com/pdf/cryotomy/cryostar-NX70-en/
10x Fresh Frozen Sample Prep Videos
https://pages.10xgenomics.com/sup-how-to-visium-tissue-prep.html
10x Support for Fresh Frozen Visium
https://www.10xgenomics.com/support/spatial-gene-expression-fresh-frozen
10x Demonstrated Step by step Protocols for Fresh Frozen Visium
https://www.10xgenomics.com/support/spatial-gene-expression-fresh-frozen/documentation/steps/tissue-prep
Microtome for 10x FFPE-CytAssist workflow
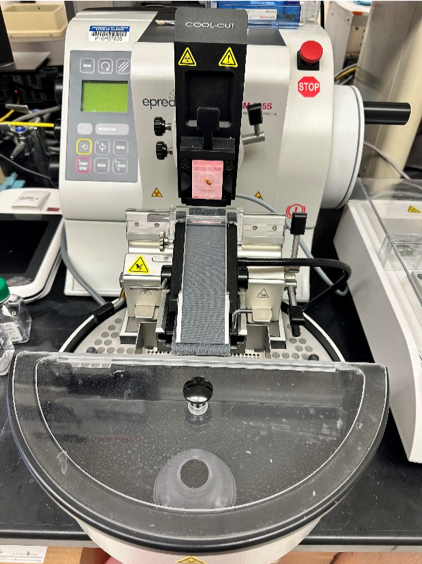
The System
https://epredia.com/solutions/microtomy-solutions/
Operating Manual/Brochure
https://epredia.com/pdf/microtome/HM355S-en/
Typical 10x workflow involving CBC core infrastructure at Illinois
Visium Spatial transcriptomics libraries (10x Genomics) will be constructed at the University of Illinois Roy J. Carver Biotechnology Center’s (CBC) Cytometry and Microscopy to Omics Facility. Fresh frozen OCT embedded tissues will be sectioned and placed onto a Tissue Optimization Slide with eight capture areas each having thousands of spots with poly-dT capture probes. Tissues will be permeabilized for 3-30 minutes (time course). mRNAs are annealed to oligos and converted to cDNA with a fluorophore and evaluated with a Zeiss LSM 980 Airyscan II super-resolution microscope. The permeabilization conditions producing the brightest image with the least diffusion will be chosen for processing of tissues. Tissue sections will be placed on a Visium Spatial Gene Expression slide which contains four capture area square (6.5x6.5mm), with ~5000 spots/square barcoded with poly-dT oligos. Sections will be fixed, stained with H&E and visualized with the same Zeiss LSM 980 Airyscan II super-resolution microscope equipped with a Zeiss Axiocam 712 color camera. After permeabilization, mRNAs will be converted into spatially-barcoded cDNA and transferred to the CBC DNA Services laboratory where they will be amplified, assessed for quantity and quality, and converted into sequencing -ready, dual-indexed libraries. The final libraries are quantitated on Qubit and the average size determined on the AATI Fragment Analyzer (Agilent, CA) and diluted to 5nM concentration and further quantitated by qPCR on a Bio-Rad CFX Connect Real-Time System (Bio-Rad Laboratories, Inc. CA). The libraries are then pooled by qPCR value and capture spot coverage and sequenced on an Illumina NovaSeq 6000 to a length of 28 nt (read 1, contains the spot barcode and unique molecular identifier used for removing PCR duplicates), 10 nt for each index (libraries contain unique dual indexes to prevent index switching) and 150 nt for read 2 (the cDNA read) to a minimum depth of at least 50,000 cDNA reads per spot. Fastq.gz will be demultiplexed with SpaceRanger 2.0.0 and sent to the HPCBio facility of the CBC for further analysis. Data are processed and visualized using Space Ranger Analysis Pipelines and Loupe browser using the appropriate reference transcriptome. Visium uses the cDNA barcodes to associate the transcripts to an X–Y coordinate on the slide, which will then be used to overlay the H&E-stained image with the transcript information from a spatial viewpoint. The R package Seurat will be used to read in both the count data and the images. Principal component (PC) analysis will be performed and at least the top 30 PCs were used in both nearest neighbor cluster calling and Uniform Manifold Approximation and Projection (UMAP) dimension reduction as the first steps in the statistical analyses. Further steps are tailored to the needs of each research project and could include optimization of the cluster calling based on tissue geography, differential gene expression testing between clusters and/or between samples, identification of spatially variable genes using tissue locations as input, and down-stream data mining of identified gene sets.