Cell Cycle Analysis
Cell cycle analysis is a very common flow cytometry application. By using a DNA-specific stain, one can determine a DNA profile e.g. find percentage of the population in G0/G1, S, and G2/M. This information can be used to, for example, monitor the effect of an anticancer treatment.
The Cytometry and Microscopy to Omics now offers an online MultiCycle AV add on to our FCS Express analysis program. Please contact the facility if you need help using MultiCycle.
Below are some examples of cell cycle data acquired using a BD LSR II flow cytometer and analysed with FCS Express software.
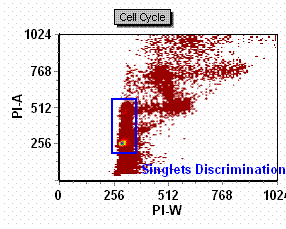
FCS Express Analysis
| Diploid | 100% |
| Diploid G1 | 82% |
| Diploid G2 | 6.72% |
| Diploid S | 11.28% |
| G2/G1 | 1.90 |
MultiCycle (with singlet discrimination)
| Diploid | 100% |
| Diploid G1 | 79.77% |
| Diploid G2 | 4.57% |
| Diploid S | 15.65% |
| G2/G1 | 1.92% |
Common Cell Cycle Dyes Used at The Facility
|
Probes |
Facility Instruments |
Excitation laser line |
Emission Filter [nm] |
|
Propidium Iodide |
BD LSR II |
488 nm |
695/40 |
|
Hoechst |
BD LSR II |
407 nm |
450/50 |
|
7 Aminoactinomycin D (7AAD) |
BD LSR II |
488 nm |
695/40 |
|
DAPI |
BD LSR II |
407 nm |
450/50 |
|
DRAQ5 |
BD LSR II |
640 nm |
660 /20 |
Links
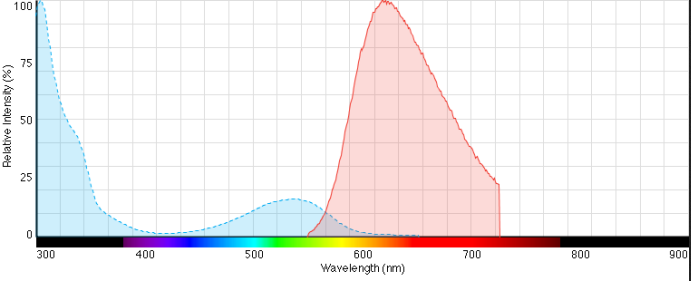
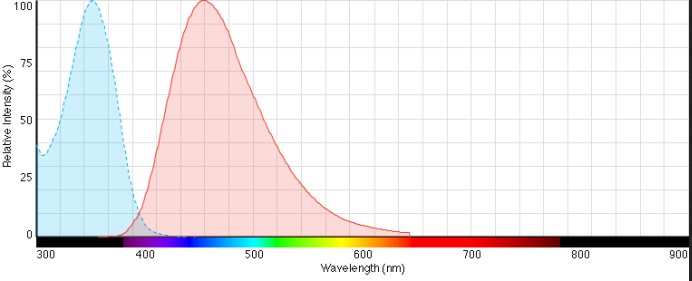
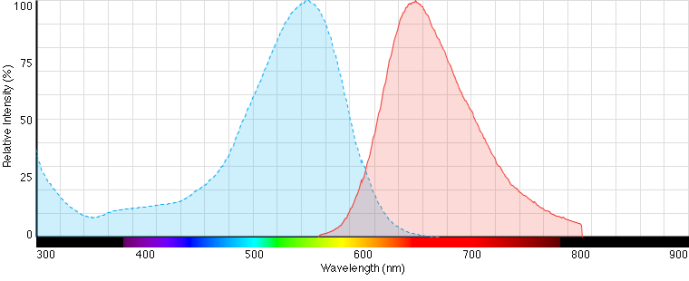
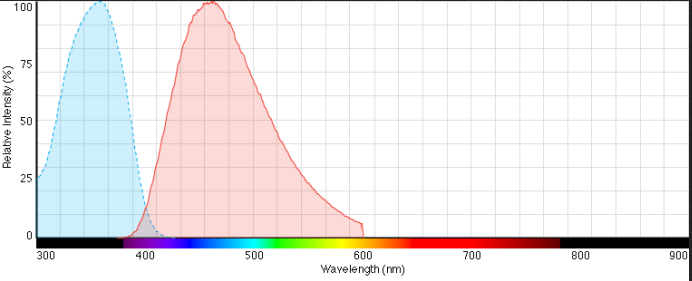
Fluorescence Spectra of Afformentioned Dyes

Vendors
Thermo Fisher
Sigma
Vybrant DyeCycle Stains
Software
FCS Express with MultiCycle
Protocols
Determining Cell Cycle Stages by CMtO
Mitochondrial growth and DNA synthesis occur in the absence of nuclear
DNA replication in fission yeast by Sazer and Sherwood
All work performed by the Roy J. Carver Biotechnology Center (CBC) should be acknowledged in scholarly publications, posters, and presentations. Proper recognition allows us to measure the impact of our work and supports our initiatives in obtaining sponsored funding. In addition, any CBC personnel who make a substantial intellectual or experimental contribution are deserving of further recognition as co-author.